Posts Tagged educational acoustics
Demystifying Acoustic Data: Part 2 – Test Material Mounting
Posted by Acoustics First in Absorption, Home Entertainment, Home Theater, Products, Recording Facilities, Theater on October 13, 2016
For anyone new to the world of acoustics, there is a multitude of terms, coefficients and numbers that are thrown around. This flood of information can seem intimidating, especially to beginners. In this series, acoustician Cameron Girard of Acoustics First® hopes to help you distinguish between what’s useful and what’s not.
Part 2: How Mounting in Testing Affects Sound Absorption Data
As I discussed in my previous article, the best way to compare the performance of sound absorbing panels is by referencing the Sound Absorption Coefficient (SAC) and Noise Reduction Coefficient (NRC). However, these coefficients are often used as marketing tools. Be on the lookout for companies that list absorption coefficients and NRCs without mention of a particular testing standard or mounting method. It’s vital to check for this information, as direct comparisons to competitors and other materials can only be made if their testing procedures are the same.
The sound absorption of a material that covers a flat surface not only depends on the physical qualities of the material but also on how the material is mounted during installation. The mountings specified in laboratory tests are intended to simulate conditions that exist in normal use, such as direct wall mounting and installation into a ceiling grid.

Many materials for treatment of walls or ceiling are tested using what is called Type ”A” mounting. Type ”A” mounting means the test specimen was placed directly on the test surface of the reverberation chamber. Lay-in ceiling tiles, on the other hand, are often tested using ”E400” mounting. The ”E” designates a sealed air space behind the specimen (simulating the air gap between a dropped tile ceiling and the structural ceiling) and the number after the ”E” is the depth of the airspace in millimeters. The airspace behind the acoustic material affects the sound absorption by acting as a bass trap. The deeper the cavity behind the panels is, the lower the fundamental of the “trapped” frequencies will be.

To see what this look like in terms of actual numbers, let’s take a look at how different mounting methods effect the sound absorption coefficients of Acoustics First’s HiPer® Panel (a low-profile, composite absorber/diffuser panel).
Since the HiPer® Panel can be used effectively in multiple applications; we had it tested in accordance to the two most-common mounting procedures, Type E-400 and Type A. The results of the laboratory tests are as follows:
|
Product Info |
Sound Absorption Coefficients |
||||||||
| Product Name | Thickness | Mounting | 125Hz | 250Hz | 500Hz | 1kHz | 2kHz | 4kHz |
NRC |
| 1″ HiPer® Panel | 1″ | E-400 | 0.43 | 0.28 | 0.51 | 0.76 | 0.99 | 1.10 | 0.65 |
| 1″ HiPer® Panel | 1″ | A | 0.09 | 0.28 | 0.78 | 0.75 | 0.94 | 0.85 | 0.70 |
As you can see from the chart, the sound absorption coefficient at 125 Hz varies greatly between E-400 mounting (SAC of .43) and Type-A mounting (SAC of .09). If mounting the HiPer® Panel in a ceiling grid, with a sizable airspace, you can expect significant low-frequency absorption, but mounting it on a wall (Type-A) will result in much less absorption at 125Hz.
Other mounting methods are available, but are not used as frequently. Here are some of the basic mounting designations (See ASTM E795 for more information.)
Type A mounting – Test specimen laid directly against the test surface (wall panel on drywall).
Type B mounting – Test specimen cemented directly against the test surface. Type B mounting is intended to simulate acoustical ceiling tiles or other sound-absorptive products adhered to a hard surface with an adhesive.
Type C Mounting—Test specimen comprising sound-absorptive material behind a perforated, expanded, open facing or other porous material.
Type D Mounting—Test specimen mounted on wood furring strips.
Type E Mounting—Test specimen mounted with an air space behind it (dropped tile ceiling).
As we’ve discussed, acoustical data can vary greatly depending on the mounting method used during testing. Acoustics First tries to include as much information about testing procedures as possible, because we feel an informed client makes the best client.
Contact Acoustics First for your all your sound control needs!
Sound Channels® – Top Product!
Posted by Acoustics First in Absorption, Classrooms, Customer Feedback, Mentions, Press Release, School & Educational Facilities on December 22, 2015
Acoustics First® Sound Channels® wall fabric has been named a ‘2015 Top Product’ by Christian School Products magazine!
http://www.cspmagdigital.com/publication/?i=284531&p=18

Christian School Products – 2015 Top Products
This article from their November issue explains why:
Merry Christmas and Happy New Year from all of us at Acoustics First!
Phones and Scones? I mean… Phons and Sones!
Posted by Acoustics First in Q&A on February 19, 2014
Since it’s been a while, I have received approval to write about phones and scones – yummy! Oh, I misread that… I can talk about phons and sones? Oh boy. I mean… hmm… uh…
Every so often, you get exposed to a term that you’ve never heard; it seems like someone just made it up – and the more you learn about it, the more made up it seems.
(Disclaimer: I swear I didn’t make these up.)
Today, I will introduce you to two of these amazingly real terms, and do my best to explain why these terms exist… prepare to be amazed!
OK. Phons and Sones are two related terms in Psycho-acoustics that refer to how humans perceive the “LOUDNESS” of sounds. These are actual real concepts. (Stop laughing.)
Don’t we all perceive sound differently? YES!
So how can you have an actual measurement based on something that everyone perceives differently? EASY!
Take a bunch of people.
Play a 1Khz sine wave.
Play another frequency.
Ask them if it sounds just as loud.
Repeat. (No kidding.)
OK, this is over simplified… Let’s start by setting some rules that make this a little easier.
For reference – whatever dB level that 1KHz wave is will be the reference for the whole group… compare a bunch of frequencies at different levels to 1Khz at 40 dB – and we’ll call all the ones that sound just as loud the “40 PHON Equal Loudness contour.”
Why? Because they sound just as loud as the 1kHz wave at 40 dB. (I’m not joking!)
Then compare a bunch to a 1KHz wave at 50dB and call all of those that sound as loud, (wait for it)
the “50 PHON Equal Loudness contour.”
Then 60dB, 70dB, 80dB… etc (see a pattern?)
Now, plot all of these from a bunch of people who hear pretty well… take an average and WHAMMO!!!
The PHON Equal Loudness contours!
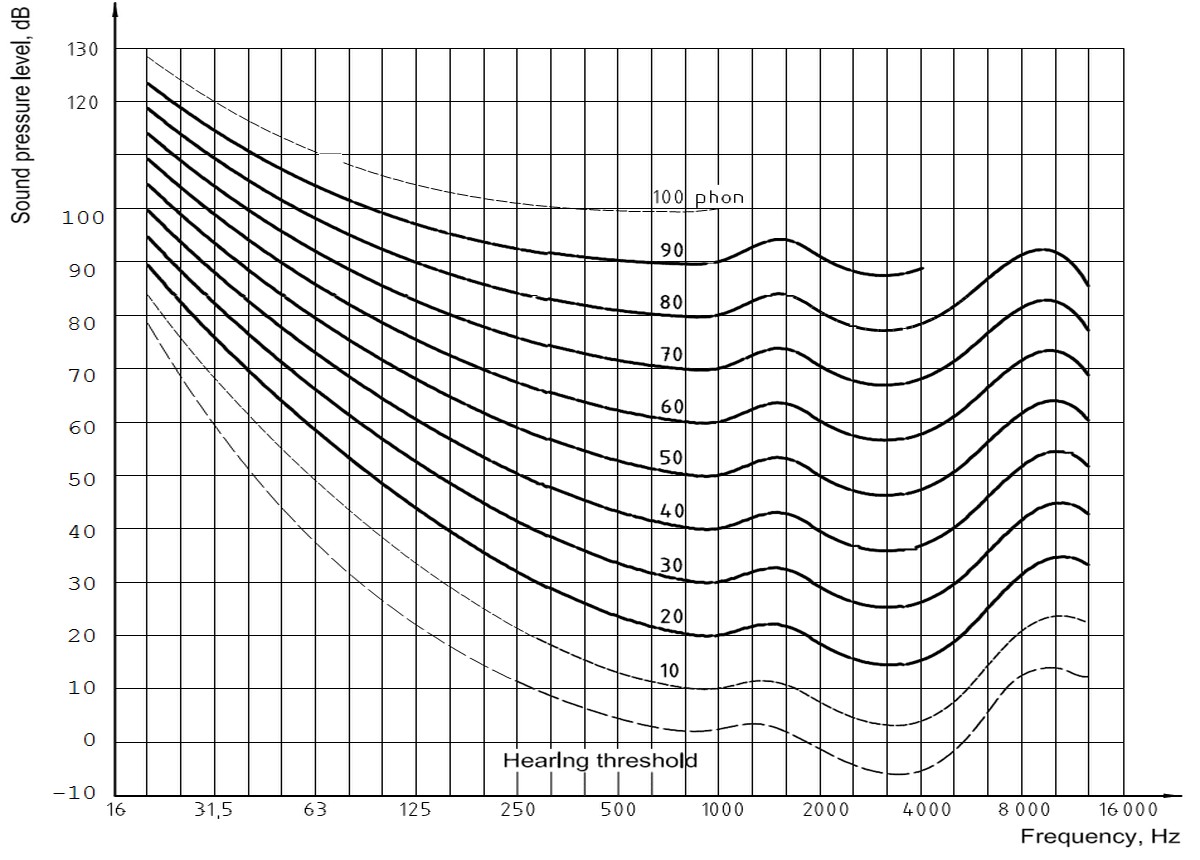
ISO 226:2003 Equal Loudness Contours.
(To be fair this is the data from a bunch of 18-25 year olds who still have reasonably good hearing…)
Remember this is PERCEIVED LOUDNESS. The average of what the test subjects said “yeah, uh, that’s just as loud, Dude.”
It seems strange doesn’t it – that these aren’t nice straight lines? That’s because the human ear is constructed in such a way to be more sensitive to certain frequencies than others.
So according to this chart – a 1KHz wave at 40 dB sounds just as loud as 125 Hz at ~60dB and 3150 Hz at ~35 dB. (All on the 40 Phon contour.)
That’s Psycho-acoustics for you. (Wow.)
So if you’re an average person with average hearing, your bass perception is terrible and over 16KHz you’re basically – well… deaf.
But you hear really well from 2kHz – 5kHz!
Anyway… what’s the point?
Phons measure how loud the human ear perceives sounds at different frequencies. (TADA!)
FINE! – then what are Sones ? To make this simple – Sones are relabeled Phons.
You start with 40 Phon being 1 Sone then double it every 10 Phon.
40 Phon = 1 Sone.
50 Phon = 2 Sones.
60 Phon = 4 Sones.
70 Phon = 8 Sones.
80 Phon = 16 Sones
90 Phon = 32 Sones
100 Phon = 64 Sones
Etc.
(Hmm, thought that would be more complicated? It is – but that’s basically it in a nutshell.)
You will almost never see a phon or a sone. Bathroom exhaust fans and blowers are sometimes rated in Sones – to let you know how quiet they are… The problem is that no one actually knew how quiet that was until now!
I guess it sounds better to say –

Quiet… Only 2.5 Sones!
“This bathroom fan operates at only 2.5 Sones!”
…Than it would be to say…

Quietish… Only loudish in frequencies you can’t hear well. So it’s not bad… Really.
“This bathroom fan resonates at over 80dB,
but it’s in a frequency range that humans don’t hear very well,
so it sounds quieter than it actually is… no… really!”
Human perception of sound is very important to the development of acoustic products – Psycho-acoustics are not a joke.
(Why are you still laughing?)
Acoustics First releases video on Vibration Isolation
Posted by Acoustics First in HOW TO, Press Release, Product Applications, Sound proofing, Video on February 1, 2013
 Acoustics First has conjured up yet another video demonstration. As the fourth in a series designed to help explain common acoustic principles, this video briefly reveals what is necessary to provide vibration isolation.
Vibration isolation can quickly prove to be obtuse and relatively difficult to understand. Common problems like footfall from upstairs neighbors, industrial noise from machinery and HVAC equipment or isolating speakers and scientific devices can require completely different approaches. Most often, an on site assessment should be completed by a qualified engineering professional to determine an appropriate acoustic solution. In many cases the solution will require a modification to the structure and implement more than a single strategy.
This simple vibration demonstration challenges to provide a basic understanding of how acoustical materials may be used to prevent the spread of mechanical noise and vibration through existing structures like walls, floors and ceilings.
In this acoustic demonstration, a surface mounted piezo transducer connected to an analog meter will register levels of sound vibrations transmitted to the table. A vibrating device placed directly on the surface will transmit sound vibrations and resonate loudly throughout the table. These vibrations will register on the analog meter. By inserting isolation materials between the device and the surface, the mechanical sound transmission is reduced and sound no longer registers on the meter.
VIBRATION ISOLATION DEMONSTRATION: Controlling Mechanical Sound Transmission
CLICK HERE FOR MORE ON: VIBRATION CONTROL PRODUCTS
Soundproofing: Using Multiple Materials to Acheive Sound Isolation (Video)
Posted by Acoustics First in Press Release, Products, Video on March 16, 2011
 Soundproofing: Using Multiple Materials to Achieve Sound Isolation (Video)
When attempting to soundproof a room, there are various levels of sound isolation and many different types of materials available. How far you go with your construction will depend mostly on they type of sound you wish to abate. The acoustic solution needs to be designed around your specific application. Is it the noise of an industrial plastic shredder or speech from an adjacent office? (alt. Is it the noise of a neighboring industrial plastics shredder or do you need to isolate your studio control room?)
A typical wall construction consists of two layers 1/2″ gypsum applied to either side of a 2×4 wood or metal stud. Many of these walls for residential and commercial interiors will lack insulation in the cavities. This type of contruction will yeild an STC (Sound Transmission Loss) around 31 – 33. By simply adding a layer of fluffy glass fiber insulation to the cavity, the STC will increase by 4-5 points and prevent sonic resonance. Additionally, a layer of mass loaded vinyl barrier will add another 4-5 points. We have prepared a simple video demonstration to illustrate how using multiple layers of common building materials will improve STC values. Click here for the video: http://www.acousticsfirst.com/educational-videos-the-barrier-and-the-bell.htm
The Barrier and the Bell (Soundproofing Demonstration) from Acoustics First on Vimeo.

You must be logged in to post a comment.