Archive for category Products
Autism Spectrum Disorder and Acoustics
Posted by Acoustics First in Classrooms, Product Applications, Products, School & Educational Facilities, Sound proofing, Teaching Rooms on March 25, 2026
People with Autism Spectrum Disorder (ASD) frequently report different sensory experiences, especially with sound. Many experience hypersensitivity (overreaction to stimuli like noise or light) or hyposensitivity (reduced response, requiring stronger input). Unlike most individuals, they may not adapt to constant background noise, which can remain overwhelming. Tools like noise-canceling headphones and stim/fidget toys can help manage stress and support self-regulation.

Some autistic individuals also experience auditory processing disorder (APD), where sounds are heard but not easily understood. This can make following speech in noisy environments—like classrooms—especially difficult, even if other auditory skills remain strong.
Research on autism has often focused on traits, causes, and treatments, sometimes framing autistic individuals as the problem. A more balanced, modern, view considers how environments and nonautistic people contribute to disabling experiences. Under the social model of disability, society shares responsibility for reducing these challenges. Recent perspectives expand beyond individual traits to include social attitudes, accessibility tools, inclusive education, and building design.
The design of built environments plays a major role in comfort and performance, yet acoustics are often overlooked compared to lighting or air quality. Poor sound conditions—such as low signal-to-noise ratios—can hinder learning, particularly for children, people with hearing difficulties, or nonnative listeners. While accessibility standards address physical barriers, they rarely consider acoustic needs for autistic individuals. Studies show that high noise levels can increase distress-related behaviors in children living with autism. Both children and adults report that schools can be overwhelming due to noise, bright lights, and unpredictability, leading to fatigue and reduced learning.
To create more inclusive spaces, designers should focus on acoustics. This includes organizing layouts predictably, adding quiet “escape” areas, separating noisy and quiet zones, and using transitional spaces to ease sensory shifts. Effective sound isolation—through walls, windows, and floor/ceiling—is essential, as is reducing internal noise from building systems and other noise sources. Windows are often the weakest link through which sound can leak, but this can be mitigated with multi-pane window construction with an appropriately airtight and resilient joint sealant. The Sound Transmission Class (STC) and Outdoor-Indoor Transmission Class (OITC) of cavity wall systems can be improved with added mass, resilient layers and cavity absorption. Partitions should extend to their full height and be sealed to the structure of the roof deck or floor above. Penetrations through sound isolating partitions should be avoided. Wherever penetrations are unavoidable, they should be packed with insulation and sealed with a resilient joint sealant to minimize the leakage of sound.
Using sound-absorbing materials can further improve comfort. Sound Channels acoustic wall fabric is often specified in classrooms and “escape” rooms as it a very durable and cleanable material that provides sound absorption within speech frequencies, reducing echoes and overall noise levels.
Overall, designing for acoustic accessibility requires recognizing the diverse sensory experiences of autistic individuals. Inclusive environments should be shaped through thoughtful design and collaboration with autistic individuals, ensuring their lived experiences guide meaningful improvements.
References:
Caldas, Fernanda; Underwood, Samuel; Masiero Bruno S. and Wang, Lily M. Autism and Indoor Sounds Acoustics Today 20 (2) 21-29.
Acoustics First® releases new 3D Model Repository.
Posted by Acoustics First in Press Release, Products on February 25, 2026
For those users who like to design visually, Acoustics First® has released a new 3D model repository at:
https://acousticsfirst.com/acousticsfirst-3d-model.htm
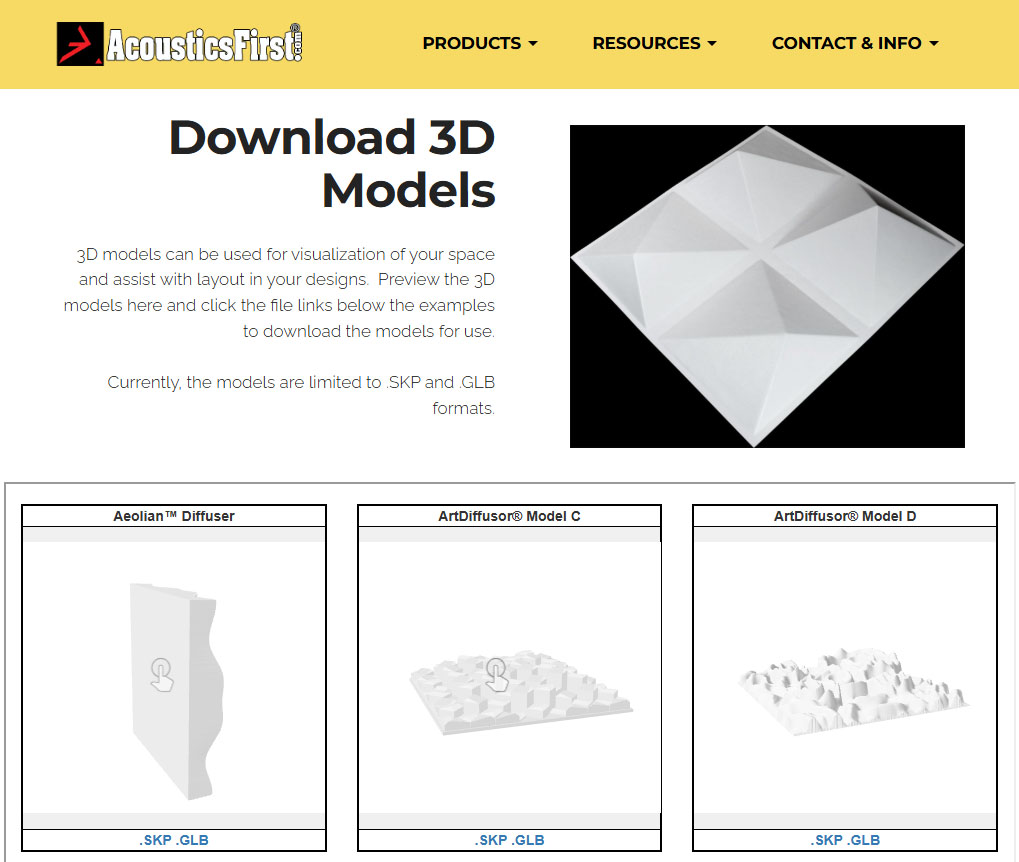
Currently, the 3D models are available in .SKP and .GLB format for:
More models are coming soon. The repository is available at https://acousticsfirst.com/acousticsfirst-3d-model.htm or it is linked from any of the diffuser pages listed above.
Big vs. Bigger: 2′ vs 4′ Acoustic Diffusers
Posted by Acoustics First in Diffusion, Product Applications, Products on December 16, 2025
A couple common form factors in acoustics are based on building material sizes. Ceiling grids are a common place to install acoustic devices, and you will find that many are built to either work in a 2’x2′, 2’x4′, or 4’x4′ ceiling grid installation. This makes sense, but did you know that these devices also perform differently in some cases due to their dimensions? This is especially true with acoustic diffusers.
When you’re tuning a room—whether it’s a studio, theater, rehearsal space, or even a high-end listening room—acoustic diffusers are one of those rare tools that improve clarity without taking the life out of the space. Designs like the Double Duty Diffuser, Pyramidal Diffusers, and Quadratic Diffusers all share that same mission: redistribute sound energy so your room feels open, natural, and honest.
But while they may look similar in concept, their size changes the game. A 2’x2′ panel and a 4’x4′ panel both diffuse sound, but their effect—especially in the low-frequency and low-mid ranges—can be very different.
2’x2′ Diffusers — Compact Control
2’x2′ units are the most modular diffusers in the lineup. Their smaller footprint makes them ideal for:
- Breaking up mid and high-frequency reflections
- Treating small and medium rooms
- Sitting comfortably in grid ceilings or tight wall spaces
Because of their size, 2’x2′ diffusers don’t interact as much with the low-frequency energy in a room. Bass waves—being physically large—tend to wrap around smaller objects. The result? Excellent clarity improvements in the mids and highs, with a very predictable diffusion performance. The Double Duty Diffuser and Pyramidal diffusers have been a standard in breaking up planar surfaces for decades. While their diffusion in low frequencies is limited at this size, the air cavities do help control some upper bass frequencies through absorption.
The tuned mid frequency effects of the 2’x2′ quadratic, and the smooth performance of the Double Duty or Pyramidal diffuser are perfect for control rooms, edit rooms, drum booths, and anywhere you want accuracy without sacrificing sparkle.

4’x4′ Diffusers — Where Diffusion meets Bass Control
Now we get to the big ones.
A 4’x4′ diffuser is similar in concept to its smaller relatives, but the scale moves it into a different acoustic category. At this size, diffusers begin to influence longer wavelengths, which opens the door to something smaller diffusers often struggle with…
Low-frequency interaction
Large diffusers present enough depth, volume, and surface area to affect the bass spectrum. The extra size creates cavities which are tuned to reduce bass, and they have surfaces large enough to redirect those lower frequencies.
- Break up standing waves in the low-mid range
- Reduce modes and nodes common in rectangular rooms
- Add a sense of openness to the bass field
- Prevent buildup behind listening positions
In other words: same diffuser concept, very different low-end behavior.
Wide-area coverage
A single 4’x4′ panel can modify a huge portion of a wall, creating an even, spacious character that feels less like “treatment” and more like a room that’s naturally well-behaved.
These panels shine in larger studios, live rooms, and worship spaces—anywhere you need diffusion that reaches deeper into the frequency spectrum – and can break-up large, flat, specular surface reflections, which are responsible for flutter, echoes, bass buildup, and long reverb times.
Which do you need?
There are two main factors in the decision: space and performance requirements. In certain environments, it’s impractical or impossible to install large 4’x4′ or larger diffusers; It also may not be the best solution – even if it may appear to be on paper. While a single, large barrel diffuser may appear ideal, you may not have enough physical space to allow the diffusion to develop – where several smaller diffusers would be the better solution.
In short, your physical space and acoustic conditions will dictate which size elements will give you the most benefit in your environment.

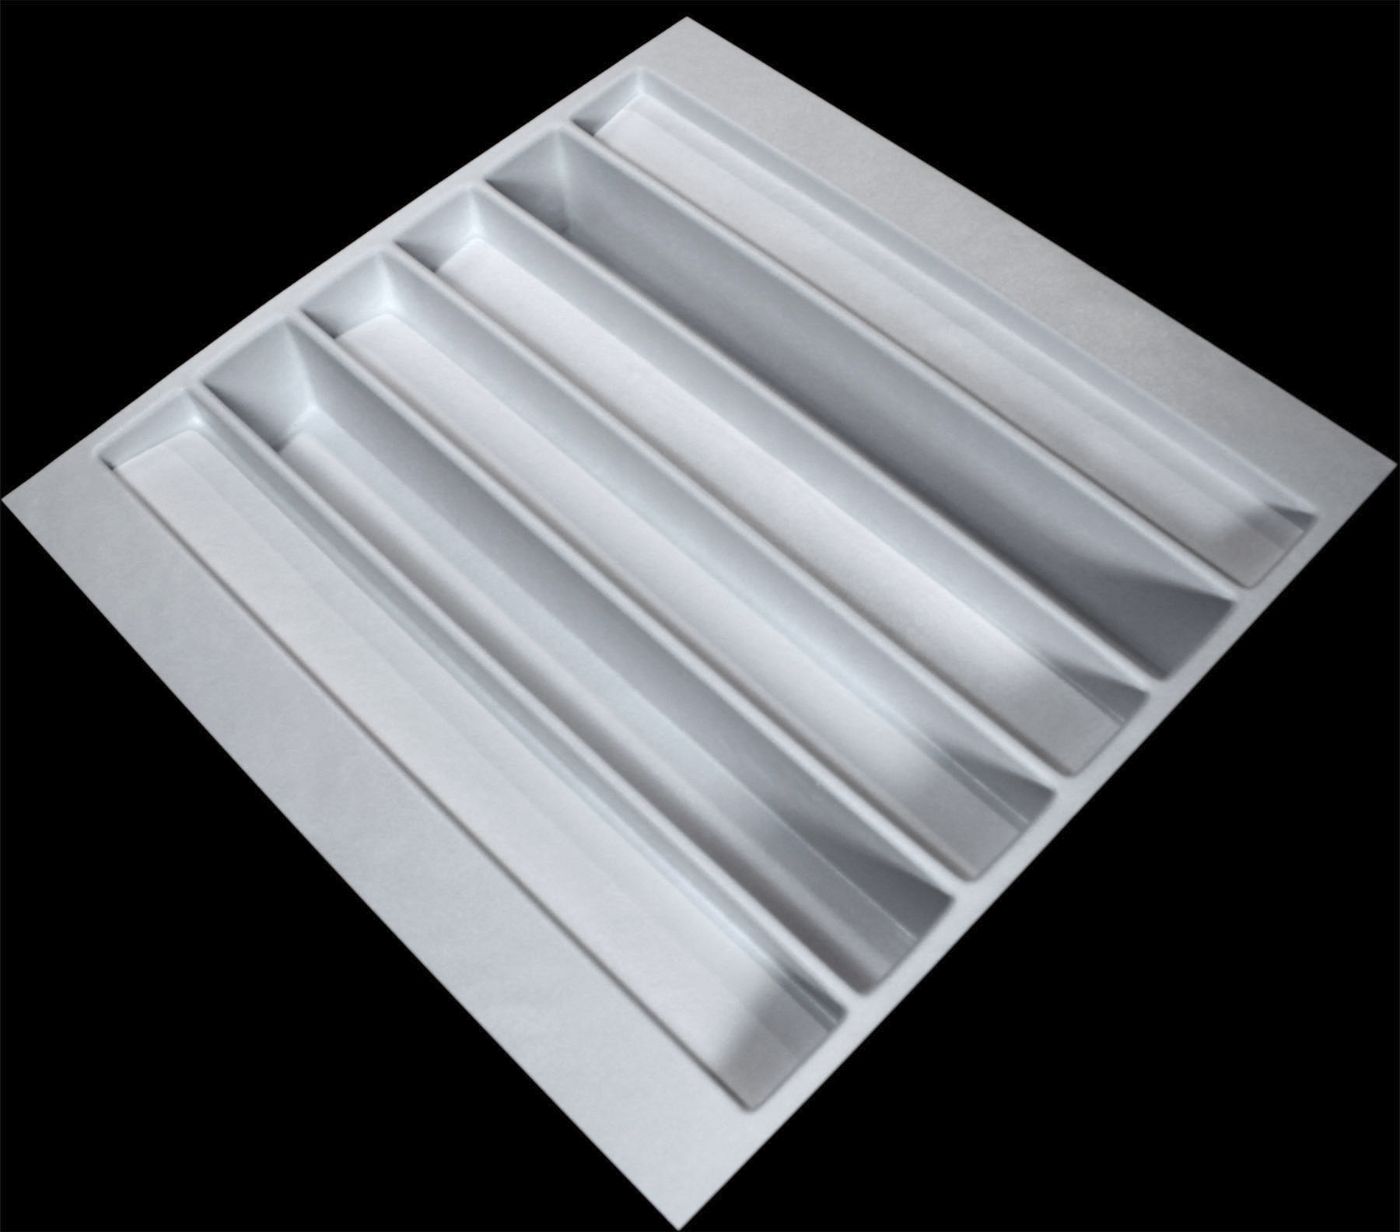
Similar, yet different: Angled QRD vs. Standard QRD
Posted by Acoustics First in Diffusion, Product Applications, Products on August 19, 2025
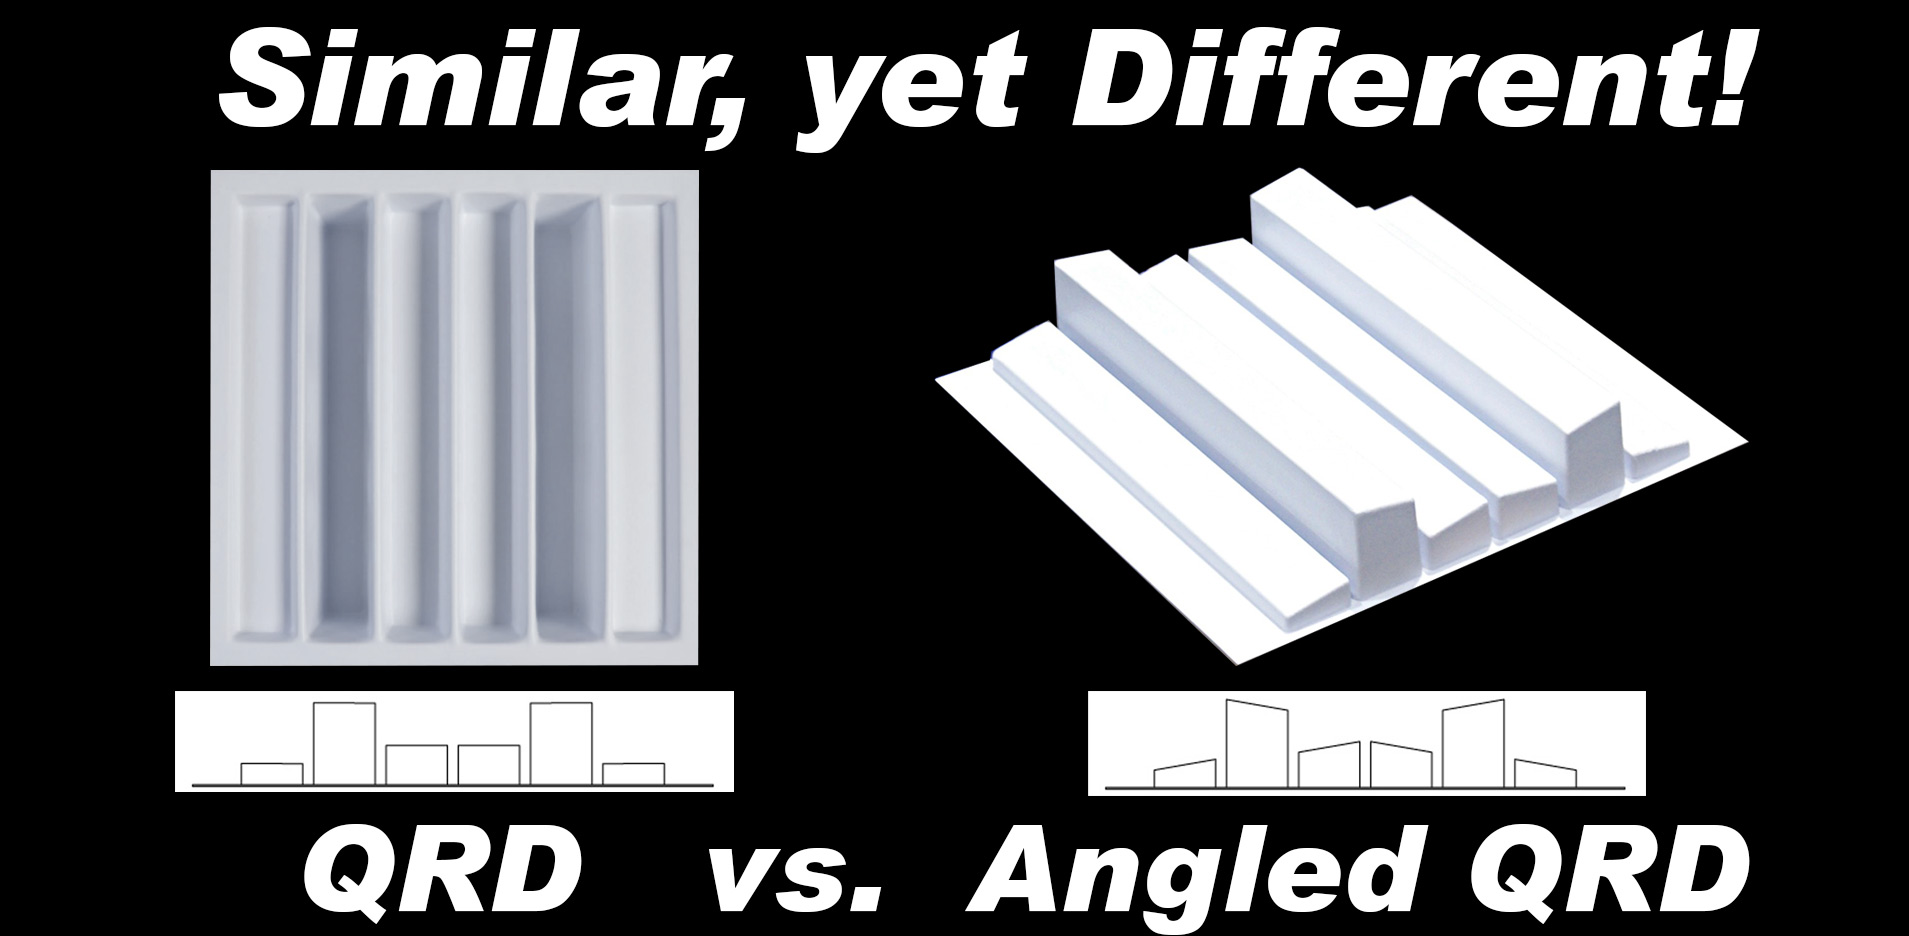
In this installment of “Similar, yet Different,” we explore the similarities and subtle differences between a classic, standard 1D QRD and a modern, angled 1D QRD. While being based on the same mathematic function for their design, there are a couple subtle differences in the performance of these devices.
Quick review. A Quadratic Residue Diffuser is based on a mathematic equation that states that the Well Depth is decided based on the square of the position of the cell and the remainder of when it is divided by a prime number. (We know it sounds really complex… but this is how the ratios of the wells are calculated to maintain a balance of magnitude across the face of the device.)
The equation looks like this:
Well Depth = (n² modulo p)
(Note: there will not be a quiz!)
As it was stated, both of the devices use the identical calculation when coming up with their wells… but there is one important change – the well bottoms are flat on the standard QRD and angled on the angled quadratic. This change makes this diffuser perform differently in 2 key ways:
- The Diffusion Pattern is wider on the angled QRD.
- There is a more subtle transition from one frequency to the next on the angled QRD.


When you look at the two sets of polar pattern above, you will notice that the Angled QRD has a wider pattern, as shown in the first-column, horizonal polar pattern (at 2000Hz especially), where the standard QRD is a more forward-focused pattern.
What does that mean in practice?
Both of these diffusers have a 1D pattern, but the flat bottoms of the standard QRD primarily use diffraction and incidence angle to widen the diffusion… the rest of the diffusion works on the principal of phase offset from the depth of the wells and the time of travel. The Angled QRD introduces an angle which means that one side of the well is deeper than another. This changes the reflection angle, time of travel, and, in turn, degrees of phase shift depending on where the sound strikes the inside of the well. This modification smooths the transition of phase from well to well – as the wells themselves have a range of phase change. This angle also causes the sound to be redirected toward the inner walls of the wells, causing it to change direction from the angle of incidence – widening the pattern further, changing the travel time, and basically bouncing sound around more.
There are some situations where the standard QRD‘s narrow pattern and well-defined transition frequencies may be preferable. In some practice rooms or larger listening spaces, there may be a need for the diffusion to be a little more directional, maybe to hit (or avoid) a certain position in the room. In these scenarios, the standard quadratic may be the recommended choice. In other spaces where you want the reflections to spread out more rapidly – maybe in smaller rooms or spaces where you need to get more coverage from ceiling reflections – then the angled quadratic may be more appropriate.
In closing, while these two devices have a nearly identical design, a small difference can have a big effect on the performance of the diffuser – and how you use them.
Eight very different 2′ x 2′ sound diffusers.
Posted by Acoustics First in Diffusion, Product Applications, Products, Recording Facilities on June 30, 2025
Acoustics First® has maximized the idea of adaptable designs. One of the most common modular architectural elements is the 2′ x 2′ ceiling grid. While standard, fiber ceiling tiles have their uses, specialized acoustic environments require higher-performing materials – for both absorption and diffusion. While Acoustics First® excels with its Sonora® and Cloudscape® Ceiling tiles, today we are going to focus on the wide range of 2’x 2′ diffusers that have been developed over the several decades.
Sound diffusers in a 2′ x 2′ format have several advantages, other than just being placed in a ceiling grid to help diffuse the ceiling. They integrate well on walls and in arrays, where they can help break up large flat surfaces and help minimize flutter and standing waves from parallel surfaces. While they provide many different aesthetic options, there are also many different functional types of diffusers available in this form-factor to address different acoustic issues, from flutter, bass issues, targeted frequency absorption, and geometric scattering. Let’s look at some of these devices and their uses.
Geometric Diffusers.
Geometric diffusers have been around a long time. These devices break up large flat surfaces and redirect or “scatter” those reflections in different directions. They work great in environments where you need to redirect acoustic energy in a predictable way, and redistribute a specular reflection over a wider area. In a 2′ x 2′ size, you can also get a fair amount of bass absorption, due to the large cavity behind the geometric shapes creating a space that can be stuffed with absorbent material to tune it.


Quadratic/Mathematic Diffusers
Mathematic diffusers are devices that use specific calculations to design their size, shape, and structures to effect their performance. A common type is called the Quadratic Residue Diffuser (sometimes called a Schroeder Diffuser, after its pioneering inventor, Manfred Schroeder). This type uses a Quadratic Residue Sequence that optimizes uniform sound diffusion at specific design frequencies. There are different ways to implement these designs, but two common designations are based on their diffusion patters – 1D or 2D. A 1D Quadratic diffuser mostly spreads energy in one plane, and a 2D provides a hemispheric pattern.


Organic Diffusers.
Organic diffusers are a variation on the classic mathematic diffusers which use different mathematic functions to optimize the diffusion further by creating a smooth transition. Once such method is called Bicubic Interpolation. Instead of having the math restricted to having blocks at certain heights, the interpolation bridges these heights using a function that provides a smooth transition to the next target height. This transition creates unlimited resolution in the frequencies within it’s functional range, providing expanded uniformity throughout its range, and increasing its capabilities. As different frequencies are affected differently depending on their wavelength – the organic diffusers have no hard edges to define their pattern and look differently to different frequencies and energy from varied sources.

These diffusers all have the ability to be used in different types of installations for different reasons. Many of these diffusers are mixed and matched in the same room. You will see these on the walls or ceiling, and placed in different locations. There are rooms with Double-Duty diffusers for low frequency control, Model C for Mids, and Model F for flutter, while other rooms may have Aeolians™ on the rear wall and Model C’s and Model F’s to control the ceiling.

Keep in mind, these aren’t even all the diffusers we have available, these are just the ones specific to the 2′ x 2′ format. The Aeolian™ has a 1′ x 1′ version called the Aeolian™ Mini. There are flat panel diffusers that are hybrid absorbers and diffuser like the HiPer Panel® and the HiPer Panel® Impact. There are even large format versions of the Double Duty™ diffuser, Pyramidal, and even the Quadratic Diffuser.
For more info about these diffusers, read some of our, “Similar, Yet Different Series,” where we go into more detail about our products… and how some of these are similar, yet different!”
If you have any questions as to which products you need to optimize your space, reach out to Acoustics First® and we can help you find which products will be best for your application. Remember that Acoustics First’s® full line of sound diffusers are all made in the USA, with many available in stock for quick shipping.

You must be logged in to post a comment.