Archive for February, 2024
Project: Dogfish Head Brewing & Eats + Reading a Spectrogram
Posted by Acoustics First in Absorption, Customer Feedback, Product Applications, Products, Restaurants on February 12, 2024
Dogfish Head Brewing & Eats is a brewery, restaurant and performance venue located in Rehoboth Beach, DE. This largely reflective space has a wood ceiling, an un-polished concrete floor and walls comprised of drywall, unfinished wood planks (over OSB) and glass. These hard surfaces promote reverberation and early reflections, resulting in a noisy and “muddy” sounding environment.

Acoustics First and Integrity Sound Solutions were brought in to provide solutions to remediate noise level and clarity issues.
The co-owners of Dogfish Head Brewing & Eats and their house engineer identified a few goals for acoustic treatment…
- Reduce “background” noise as levels in excess of 85dBa were common on busy nights. Under these conditions, the sound engineer would push the sound system above 95dBA to maintain music intelligibility. This results in an acoustically uncomfortable environment for patrons and wait staff (which in turn elevate their voices to be heard, further exacerbating noise level issues).
- Control excessive reverberation and latent reflections to improve live-music clarity.
- Minimize visually obtrusive acoustic treatment, particularly on the main wood ceiling.

Acoustics First recorded numerous sine sweeps using the house system (JBL line array and subs) and a calibrated Zoom H4 recorder as the receiver. The sweep was recorded from a number of positions (in front of stage, main dining area, in front of the bar and from the mezzanine level). The following charts are spectrograms of two of these sweeps. Spectrograms are a visual way of representing sound intensity (volume) across a range of frequencies. We can observe how energy levels compare between frequencies and see the response of the speakers and the room at these frequencies over time.
The spectrograms of the sine sweeps show that the house system is very good at producing the full spectrum of frequencies, which gave us more confidence in our analysis.
Reading the Spectrogram – The thickest sweep line (furthest right) is the direct speaker output and the thinner sweep lines are harmonic resonances of the speakers; you’ll notice these bands get further apart as we move up in frequency. The thickness of the sweep, showing sound intensity over time, represents the extent of early reflections. For example, a sweep recorded in an anechoic chamber would have very tight lines.
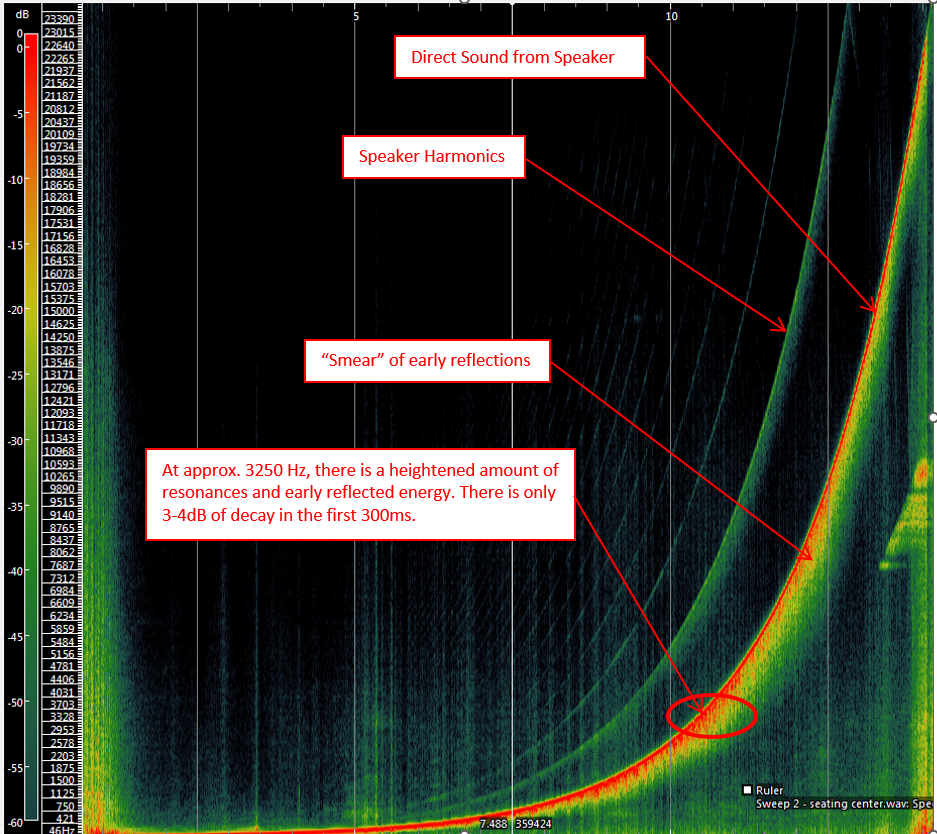
The first 6dB of early reflections are the most distracting because of their intensity. Reflections arrive slightly late, but at the same frequency, create a “smear” of sound. The faster they decay (<100ms) the more focus you have on the direct source. As you can see, low and mid frequencies stay extremely elevated for the entire 100ms, resulting in a muddy, undefined sound.
Reverberation Time – Measurement & Analysis:
Reverberation Time (RT60) is a metric that is defined as the time it takes for sound to decay 60 decibels (dB) in a room. This is a very important metric for medium-to-large room acoustics as it dictates how well a room will perform for speech and music applications. Generally, a large room with abundant hard surfaces will have a long reverb time. Surfaces that have sound absorptive qualities, like carpet and acoustic panels, reduce reverberation.
Bars/restaurants of this size with live music should have a reverberation time below 1.2s, ideally in the .6-.8s range for “high-intensity” performances, like Rock, Hip Hop or Electronic Dance Music.
We recorded a balloon pop and the subsequent reverb tail and calculated the reverb time based on the decay rate. The results were as follows.

RT60 measurement of 1.656s was recorded at the center of the room. Although this measurement is shorter than initially expected, it is still excessive given the use of the space.
Reverb Prediction:
We entered the dimensions, construction materials and furnishings of the restaurant into our acoustic calculator and made a prediction of reverb times before and after treatment. The modeled “existing” reverberation time and the measured RT60 results we took on-site were very close @ 2000Hz, which gives us confidence in the acoustical model. This means we can add acoustical treatment to the model and accurately predict the results before any changes are made to the actual room and it shows how much improvement you can expect from the recommended treatment.
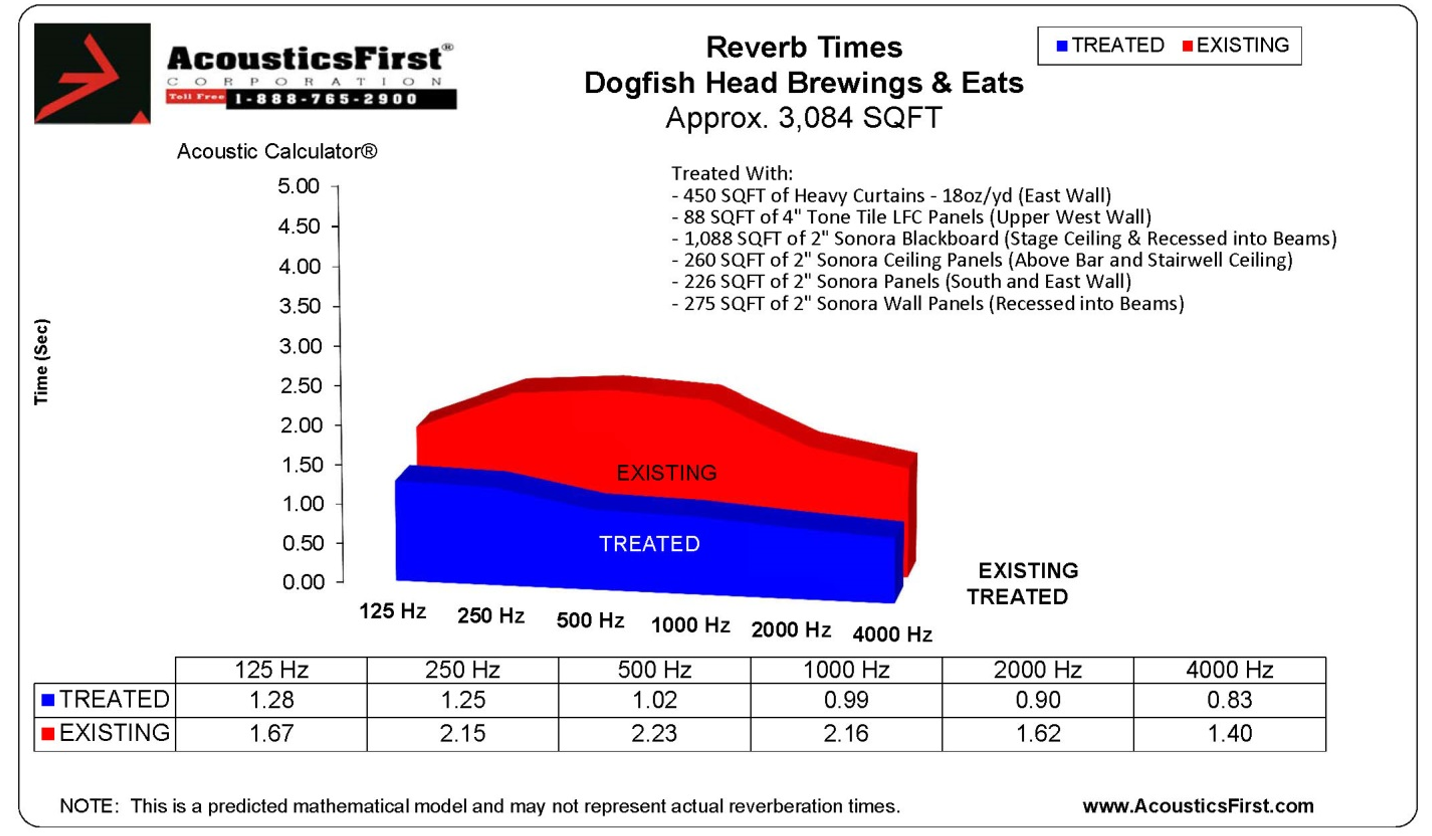
As you can see, the treated result in the model is within our target RT60 (.6-1.2s) for amplified live-music, resulting in a more suitable performance environment. This treatment would also significantly reduce noise buildup (in a well-treated room, customers and staff will not feel like they have to shout to be heard), further helping control noise levels.
To minimize the amount of visually noticeable treatment, Acoustics First specified fabric wrapped Sonora Panels (http://acousticsfirst.com/sonora-wall-panels.htm) and factory-painted Tone Tiles panels ( https://www.acousticsfirst.com/acoustic-tone-tile-panels.htm) to match the exact wall color. Acoustics First also recommend Sonora Blackboard https://www.acousticsfirst.com/sonora-black-board.htm to “fit” within the metal beams.
Most of the sound absorptive treatment was broad-band in nature. However, Low-Frequency Control (LFC) panels were utilized on the stage wall (behind the line array) to combat the early bass reflections that degrade low-frequency definition. LFC panels are a specialized absorber that focuses squarely on attenuating low-frequencies, below 250 Hz. View our website for more information – https://www.acousticsfirst.com/sonora-lfc.htm
As you can see from the pictures, Integrity Sound Solutions did amazing job with the installation.

What does the client think? Per the co-owners “The sound quality is exponentially BETTER…. The stuff in the beams just disappears!”

You must be logged in to post a comment.