Posts Tagged test data
Acoustic Material Testing: What it is and what it isn’t.
Posted by Acoustics First in Absorption, Articles, HOW TO, Product Applications, Products on November 4, 2021

Your room works as a system with many variables – some of which will affect the performance of your acoustic treatments. However, a laboratory test chamber for absorption is a reverb chamber – and they sound terrible! The test parameters have limits for placement of sources (speakers), microphones, and samples in the room to facilitate a more repeatable measurement. Incidentally, none of these parameters are made to use the material at its highest efficiency – quite the opposite. When you spread the materials around the space, they will perform differently than if you bunch them all together (which incidentally, is exactly how most are tested!) If you place materials at certain positions in a room, relative to the source and listening positions, you will optimize the performance of those materials in the space.
Still, if you are looking to buy some acoustic material (an absorber, sound diffuser, barrier, isolator, etc.), you will likely look into the tested performance of these materials. If you delve deeper into the different test numbers, like Sound Absorption Coefficients, Noise Reduction Coefficients (NRC), and Sound Transmission Class (STC), you will learn more about how they are measured and calculated. We had a previous blog (here) about mounting methods for testing, and how they simulate installations in different environments. However, in addition to different mounting methods – there are also different tests.
Different test standards with the same reported data?
Let’s say that you are looking for NRC or Sound Absorption numbers for a material – you may not know that there is both an ASTM C423 and an ISO 354 test that will give you this information. While they are comparable in many ways, there are a few variables that allow subtle differences in the measurement and calculation of these numbers. One major difference is that they allow for a different amount of material to be used in the test. The minimum test sample size for ASTM C423 is 60ft2, while the minimum in ISO 354 is 10m2 (or 107.5ft2.) The maximum amount of material is also different, with the ISO 354 maximum set to 12m2 (with an allowed increase of V/200 for rooms with a volume (V) > 200m3) and no maximum on C423.
While this variability may seem a little confusing, just remember that these tests can be run in different sized rooms with differences in setup and configuration. There are also variations in “when” the analyses begin – with the C423 starting 100-300ms after the signal is turned off and ISO 354 starting after a 5dB drop in level.
What does this mean to you?
It means that these tests don’t give you an absolutely-perfect, solid (or stable) number. The material performance values are an imperfect, but still useful, measure of performance. Even if you retest the same sample in the same room, you will likely see some variation in the results – This variation is used to calculate “Repeatability” of a test method. If you test the same material in different rooms, you are definitely going to get variation, and this variation is used to calculate “Reproducibility” of a test method. Counter-intuitively, this means that these different numbers are both accurate, even though they are not the same. From these different values, a test’s “Uncertainty” can be calculated – this is a way to show how reliable the test values are. (For information about reliability and uncertainty, read the article here.)
Other variables.
We know that the test results are not “pin-point” accurate values, however, they are a measure of material performance in an acoustic environment. The mounting methods will also contribute to real-world variations in performance. The E400 is a standard mounting method/test for ceiling treatments placed in a grid. This method tests the tiles or panels with a 400mm air gap behind them to simulate the plenum, or dead space, in the ceiling behind the tiles. 400mm is a very particular number equating to roughly 15.75 inches. What happens if your air gap is a different depth? Simple, you will get different results. The ISO 354 recommends 400mm for North America, 200mm for Europe, and 300mm for Japan – while the ASTM C423 test recommends 400mm, with other depths allowed as specified.
There are many potential variables here. For instance, “A” mount is mounted flat to a wall, while “D-5” mount is with a 5mm gap behind, and “J” mount is for free-hanging baffles. When comparing product performance, it is best to use results from the same test method with the mounting type closest to the real world installation method. While there may be variability in the results, you can adjust for the variation by learning about the uncertainty of a measurement.
So what exactly are these numbers?
The test results are a guide to help you select material for a space. This guide helps you to approximate how much of what type material you will need to address a problem. Acoustic problems will have a massive impact on the listening experience, and should therefore be minimized. However, you still need to pay attention to how and why you are using test numbers.
For example, if there is a 12 dB drop below 125 Hz at the listening position, you may have a node, or dead spot, that can be fixed with bass traps. Research products that are tested to work down below 125 Hz and calculate how much you need based on the absorption numbers. If, after you install the products, you have a 2 dB difference, even with all your calculations, you can chalk that up to the variability of the performance in different environments and the certainty of the test. So, you can just add a little more acoustic treatment or use an EQ to fine tune it.
Did you calculate wrong? Not exactly. The calculations may be correct, but if the uncertainty of a measurement is +/- 0.2 below 125Hz, that means that you may need to account for that in the calculation. (Many tests, and laboratory environments have a great deal of uncertainty below 125Hz.)
Sometimes, it’s better to figure high and have some extra pieces of material. How do you do that calculation? Well… if the uncertainty is +/- 0.2 @ 100 Hz and the test results say that the performance is a 0.8 @ 100 Hz – then re-run the calculation assuming that it does a 0.65 or 0.7 @ 100 Hz and you should get a little more square footage of material. That is still within the performance certainty of a measurement. You can say – with about 95% accuracy – that if this material was tested in a different lab, on a different day, under different conditions… it could have tested with those performance results as well.
So be informed!
Some quick points to remember…
- Test results vary from lab-to-lab, test-to-test, and day-to-day – even with the same material.
- Test results are not random, but vary within a range based on test reliability and certainty calculations.
- When calculating, you can compensate for these variations (to some degree.)
- When comparing products, account for the variability. If two products are similar in build, materials, and performance – but one is slightly higher or lower – there may be no practical difference at all… and the variation could simply be due to the test uncertainty.
The Elephant in the Lab – AudioXPress
Posted by Acoustics First in Articles, Mentions on September 3, 2020

AudioXPress turned to Acoustics First® for their “Focus on Acoustics” Edition (August 2020), to help shed light on what test data is – and what it isn’t. Many people rely on lab results when trying to find products that meet design criteria… but there are limitations to this data. The “Elephant in the Lab” is that there is no such thing as absolute, repeatable, accuracy in lab tests… and this article brings to light why that is, and why it will likely always be the case.
It also addresses the impact this has on calculation accuracy, simulations, and what is being done to address this issue.

Read the article on AudioXPress.com
You can get more information about the AudioXPress August 2020 issue here.
Comprehensive Diffuser Data Now Available!
Posted by Acoustics First in Company Information, Diffusion, Press Release, Products on February 16, 2016
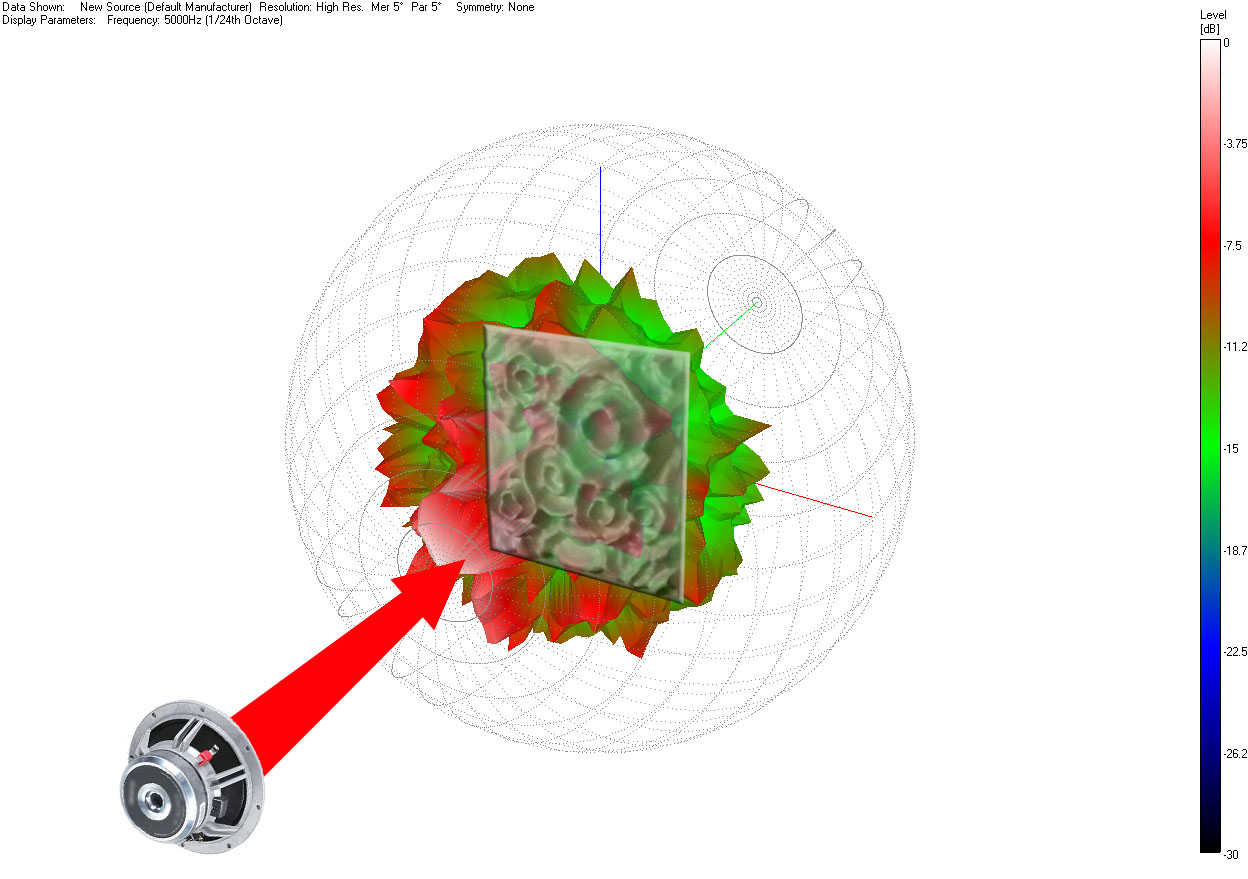
3D Polar “Balloons” are used to display a full hemispheric acoustic level response, at specific frequencies, in front of the diffusive surface. This is how a 5000Hz signal would reflect off an Art Diffusor® Model D: If we could see acoustic energy, this is what it might look like!
Acoustics First® has long been at the forefront of many exciting developments in the world of sound diffusion. In the spring of 2015, we created a method to evaluate sound diffusers using particle computer simulations. Then we utilized 3D printing technology to streamline the development of new diffuser prototypes. Recently, we received a patent for our innovative Art Diffusor® Model D design. Now we’re excited to announce the release of a new comprehensive data booklet for our entire line of sound diffusers!
In essence, this booklet represents an entirely new way to view and compare sound diffusers. “With technological advances accelerating at a staggering rate, we believed it would be advantageous to compile all of the measurable acoustic parameters of these devices, in order to develop an operating profile for each.” Since sound absorption and sound reflection can both be measured with great accuracy, we foresee a use for this data, or similar data, in virtual acoustic room modeling, along with other useful applications.
Contact us for your own print copy of the Acoustics First Diffuser Data booklet (or click here to download the PDF). The electronic data that was used to create the polar diffusion balloons is also available per request (Data compiled for Acoustics First by NWAA Labs in Elma, WA).
Currently, we are working closely with other members of the industry in an effort to develop a universally accepted standard for testing sound diffusion. In the absence of such a standard, Acoustics First is presenting this data in good faith as we believe it represents the best of what is currently available.
We look forward to sharing more advances in the field of sound diffusion!

You must be logged in to post a comment.